Adaptive NMR and qEstimate
VnmrJ has a feature called “Adaptive NMR”. It uses the qEstimate tool to facilitate the automatic setting of the number of scans for most experiments as a function of the absolute concentration of the sample.
After you click “New Study”, on the “Sample information” page, beside of the “sample name” and “Solvent”, user can enter the concentration of the sample (with unit mMol). Then for all the experiments you add for the “Queue”, the number of the scans will be automatically set.
The better one is that it is very easy to get the concentration by acquiring a simple proton spectrum and using qEstimate tool.
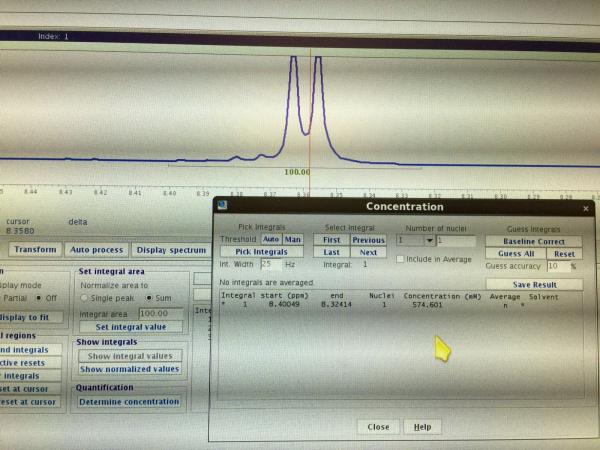
To get the concentration, display the proton spectrum; navigate to the Integration panel under the Process tab. Establish an integral region where the number of the protons is known. Make sure to include some baseline on each side of the integral region. Put the cursor in the integral region. Then hit the button “Determine concentration”. A “Concentration” calculation tool pops up. Enter the “Number of nuclei” in the integral region. The concentration value will be displayed.
The experimental times obtained from the qEstimate tool for different concentrations on the six NMR machines can be obtained from the NMR booking page. For example, click A600a, a table “Time Required for NMR Experiments on A600a” appears. Compared to other machine, it is clear that A600a is much more sensitive to others. For example, for a 10 mM sample, to get a carbon spectrum, A600a needs only 8 minutes, while A400b needs more than 5 hours.
The experimental time is inversely proportional to the square of the concentrations if the same SNR (signal noise ratio) wanted. For example, on A600a, the carbon time for 0.1 mM sample is 77859 minutes, which is 100 times of 780 minutes for 1 mM. Thus the NMR is very challenge for very dilute samples. When the sample concentration increases, the principle keeps correct. However, the qEstimate tool results will be different due to the experimental setup limitations.
0.1 mM is the minimum value, which is allowed to enter into the Adaptive NMR. If the sample concentration is lower, its experimental time can be calculated based on the above relationship.
Does the qEstimate tool give values good enough? Our test shows that for the carbon, the aromatic peak has much smaller SNR value as it could not get enough Oberhausen enhancements from protons, and has much longer T1. The typical SNR value of it is roughly 4 ~ 5. These peaks can be recognized. However, If you need better signal noise ratio (SNR) the experimental time should be increased.
All other experiments seem good. It is worthwhile to mention that the SNR value for the gHSQCAD and gHMBCAD should be obtained from the slices of the 2D data.
It has to notice that the ‘concentrations’ used here is the same or very close to the real concentrations of your sample when a 5mm tube is used. It is different when 3 mm tube or other type of tubes is used, as the NMR signal intensity detected, and SNR, is actually proportional to the material contained inside of the probe detective coil. The qEstimate tool supposes a 5mm tube is used and its effective volume is 0.60 mL. If a 3mm tube is used, the effective volume is only 0.22 mL. The machine will ‘see’ only 37% of materials for the same concentration sample compared to the 5 mm tube. Thus the results for the 3 mm tubes are:
1. When you get the concentration from the proton spectrum, just enter it to the qEstimate tool. The real concentration of your sample is actually 3 times of the value.
2. When you know the real concentration of the sample, enter only 37% of the value to the “Sample information” page.
Above are the preliminary results we have done so far. Please let us know if there are problems when it is used.